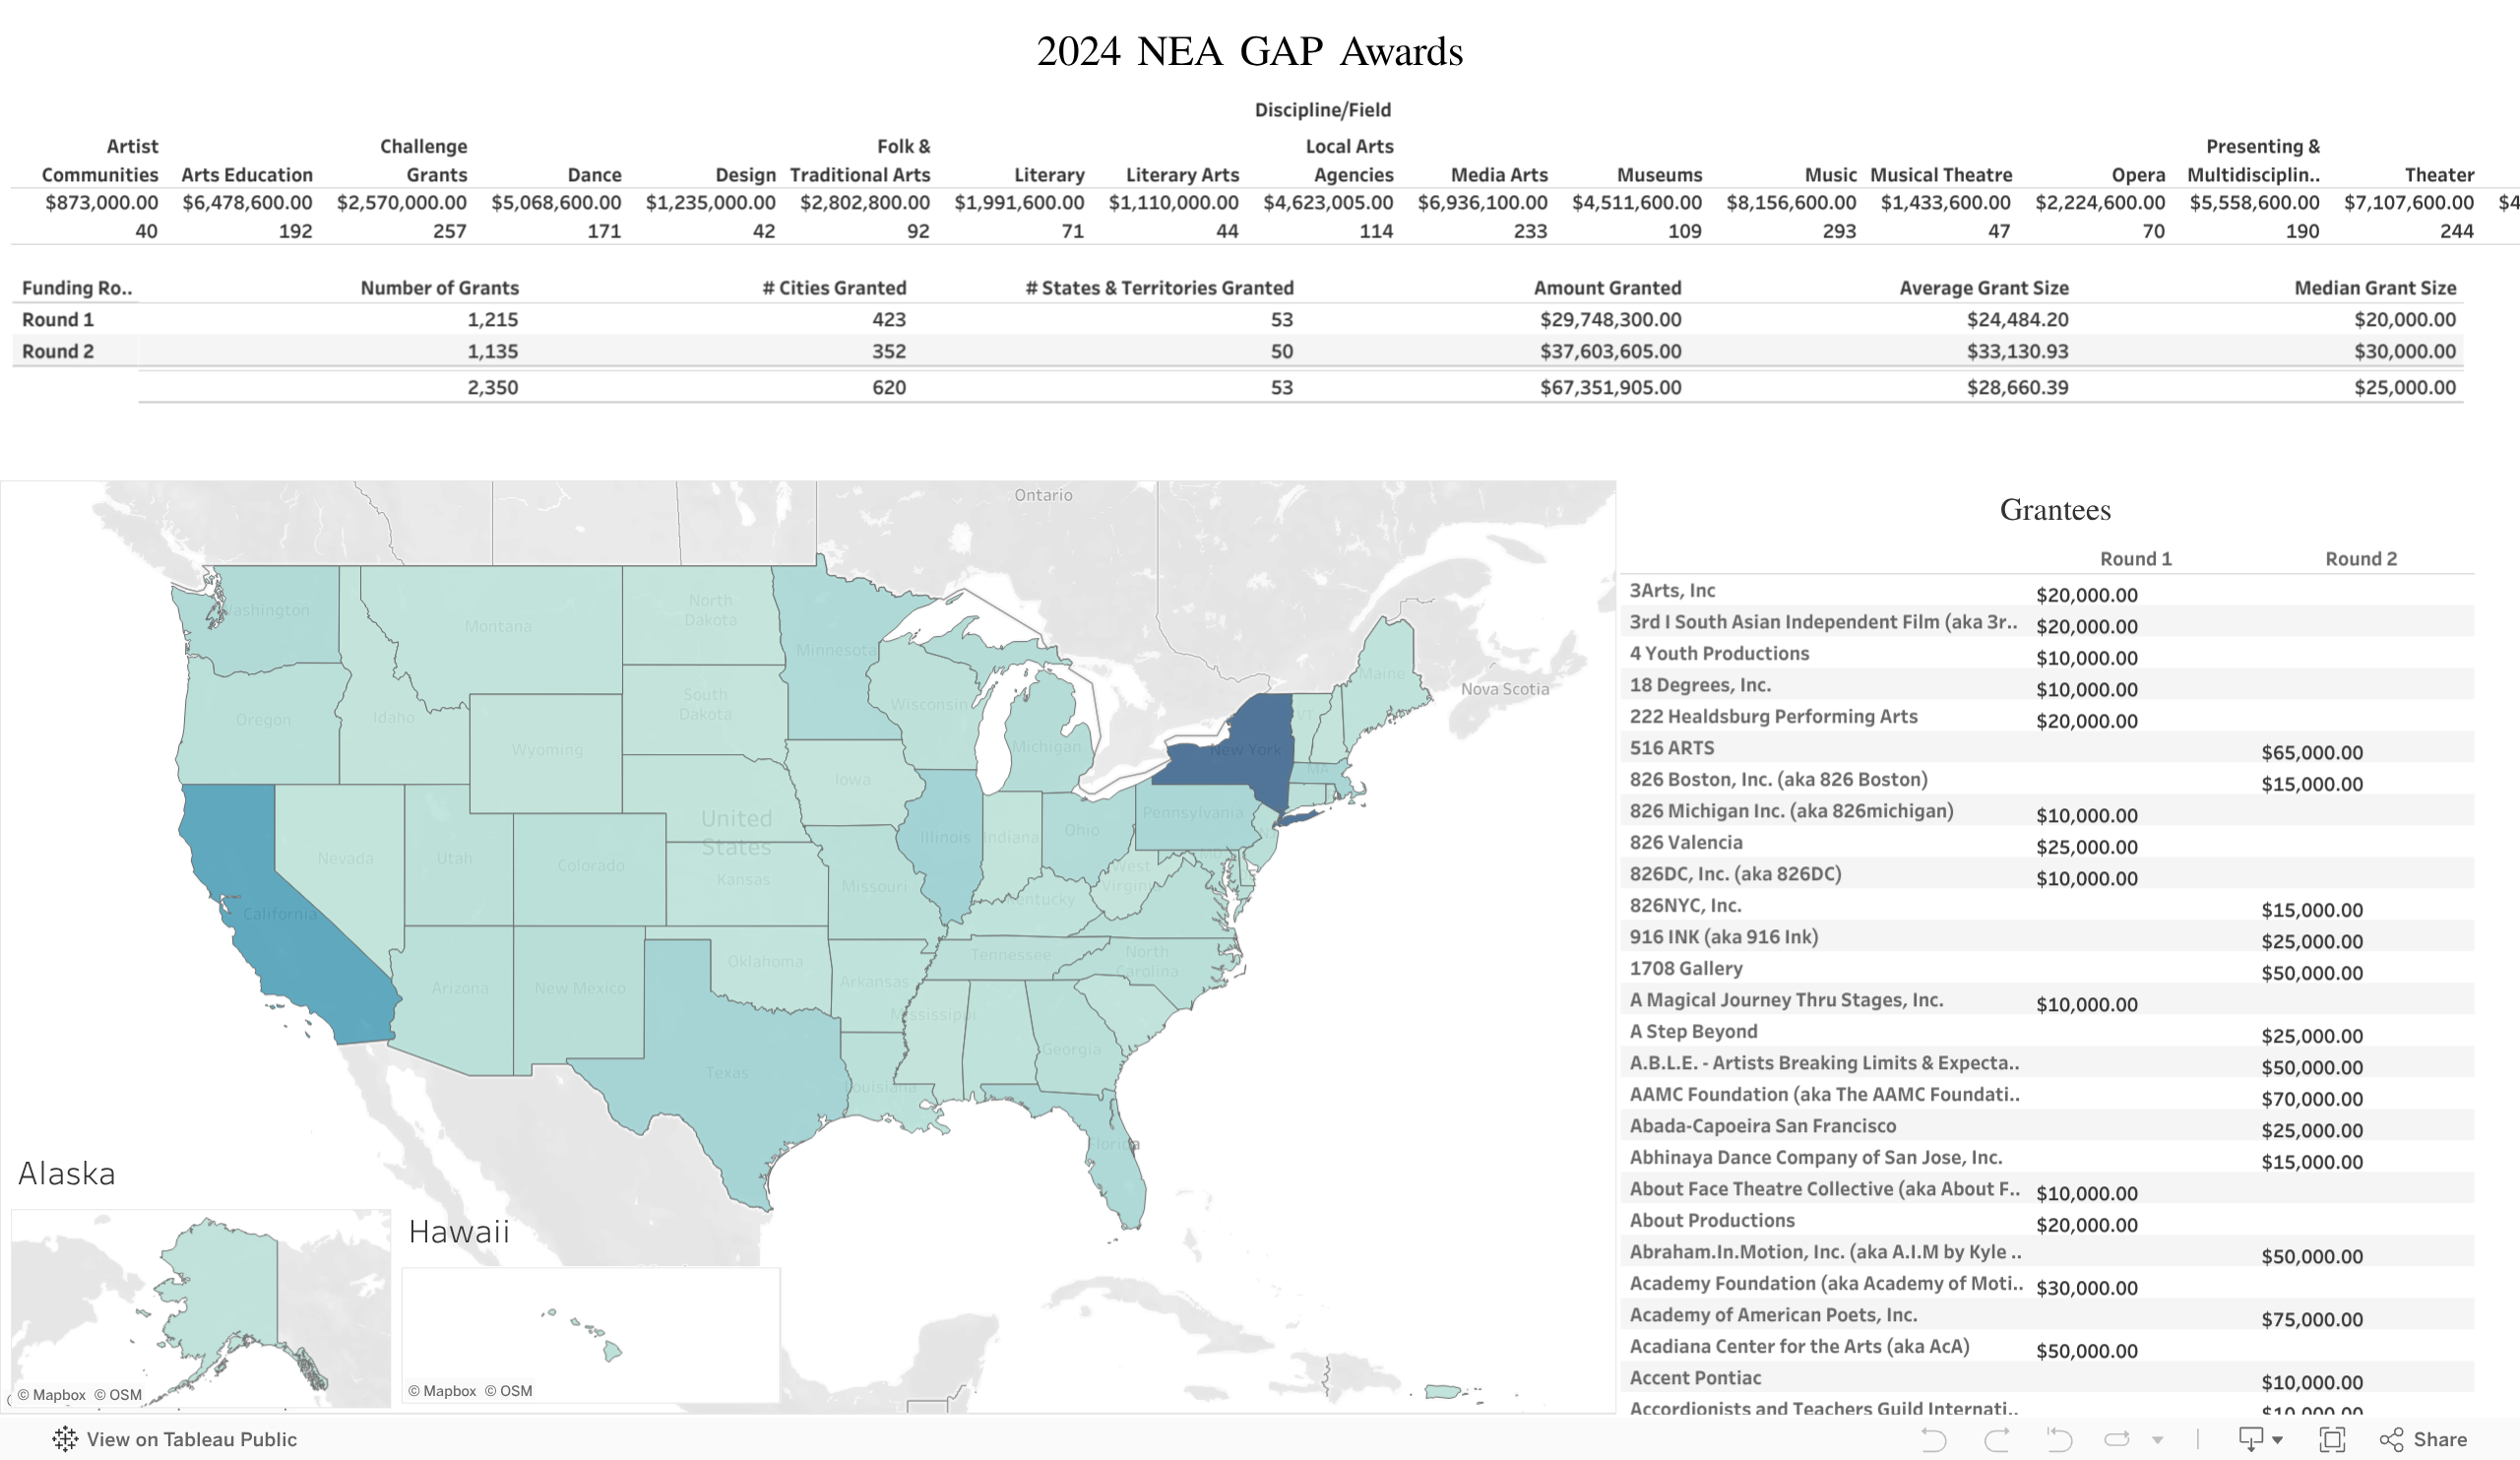
NEA GAP and Challenge Awards 2024
I got into Tableau a year ago when I saw a job posting for a civic services organization that was looking for an organizational performance director and required Tableau experience for the job. Being all about continuous improvement and organizational performance, I sought to learn more about the capabilities of Tableau. While I never heard back from the job, I really enjoyed incorporating Tableau into my analysis tools.
Building dashboards are a big reason for liking Tablelau, and this dashboard is a great reason why. Dashboards can be super helpful in giving a big picture view of data while allowing individuals to hone in on specific details or insights in just a few clicks.
This dashboard is a great example as I feature NEA GAP and Challenge Grant information. By looking at this dashboard, one can get an understanding of the difference in funding between rounds, or the timing priorities of organizations, or the funding allocations for the NEA. This dashboard was primarily made to make navigating 2024 grant awards easier compared to the PDF’s provided by the granting agency.